

Migrating Production Observability to OpenTelemetry and OTel Collector
Re-architecting logging, metrics, and tracing systems around OpenTelemetry to decouple applications from observability backends.

Hello, my name is Ahmed Eid (Eidoox), a Backend Engineer with over 3 years of experience building building reliable, scalable, and observable AI infrastructure, distributed systems, and real-time platforms.
I have been designing and operating production-grade observability platforms using OpenTelemetry, the OTel Collector, Prometheus, Loki, and Jaeger across distributed systems, where observability is treated as a platform capability rather than a collection of monitoring tools.
In this Production Insight, I want to share the architectural lessons learned from migrating to OpenTelemetry, why the industry standardized around a unified telemetry model, and how the OpenTelemetry Collector fundamentally changed the way logs, metrics, and traces are generated, processed, and delivered across modern production systems.
This is not a tutorial on OpenTelemetry or the OTel Collector. It is about a deeper production reality: observability is no longer about collecting telemetry. It is about designing a telemetry platform where applications produce standardized signals, telemetry pipelines enrich and process them, and observability backends become interchangeable consumers rather than application dependencies.
You can learn more about my background through my Personal Website.
The Observability Stack Before OpenTelemetry
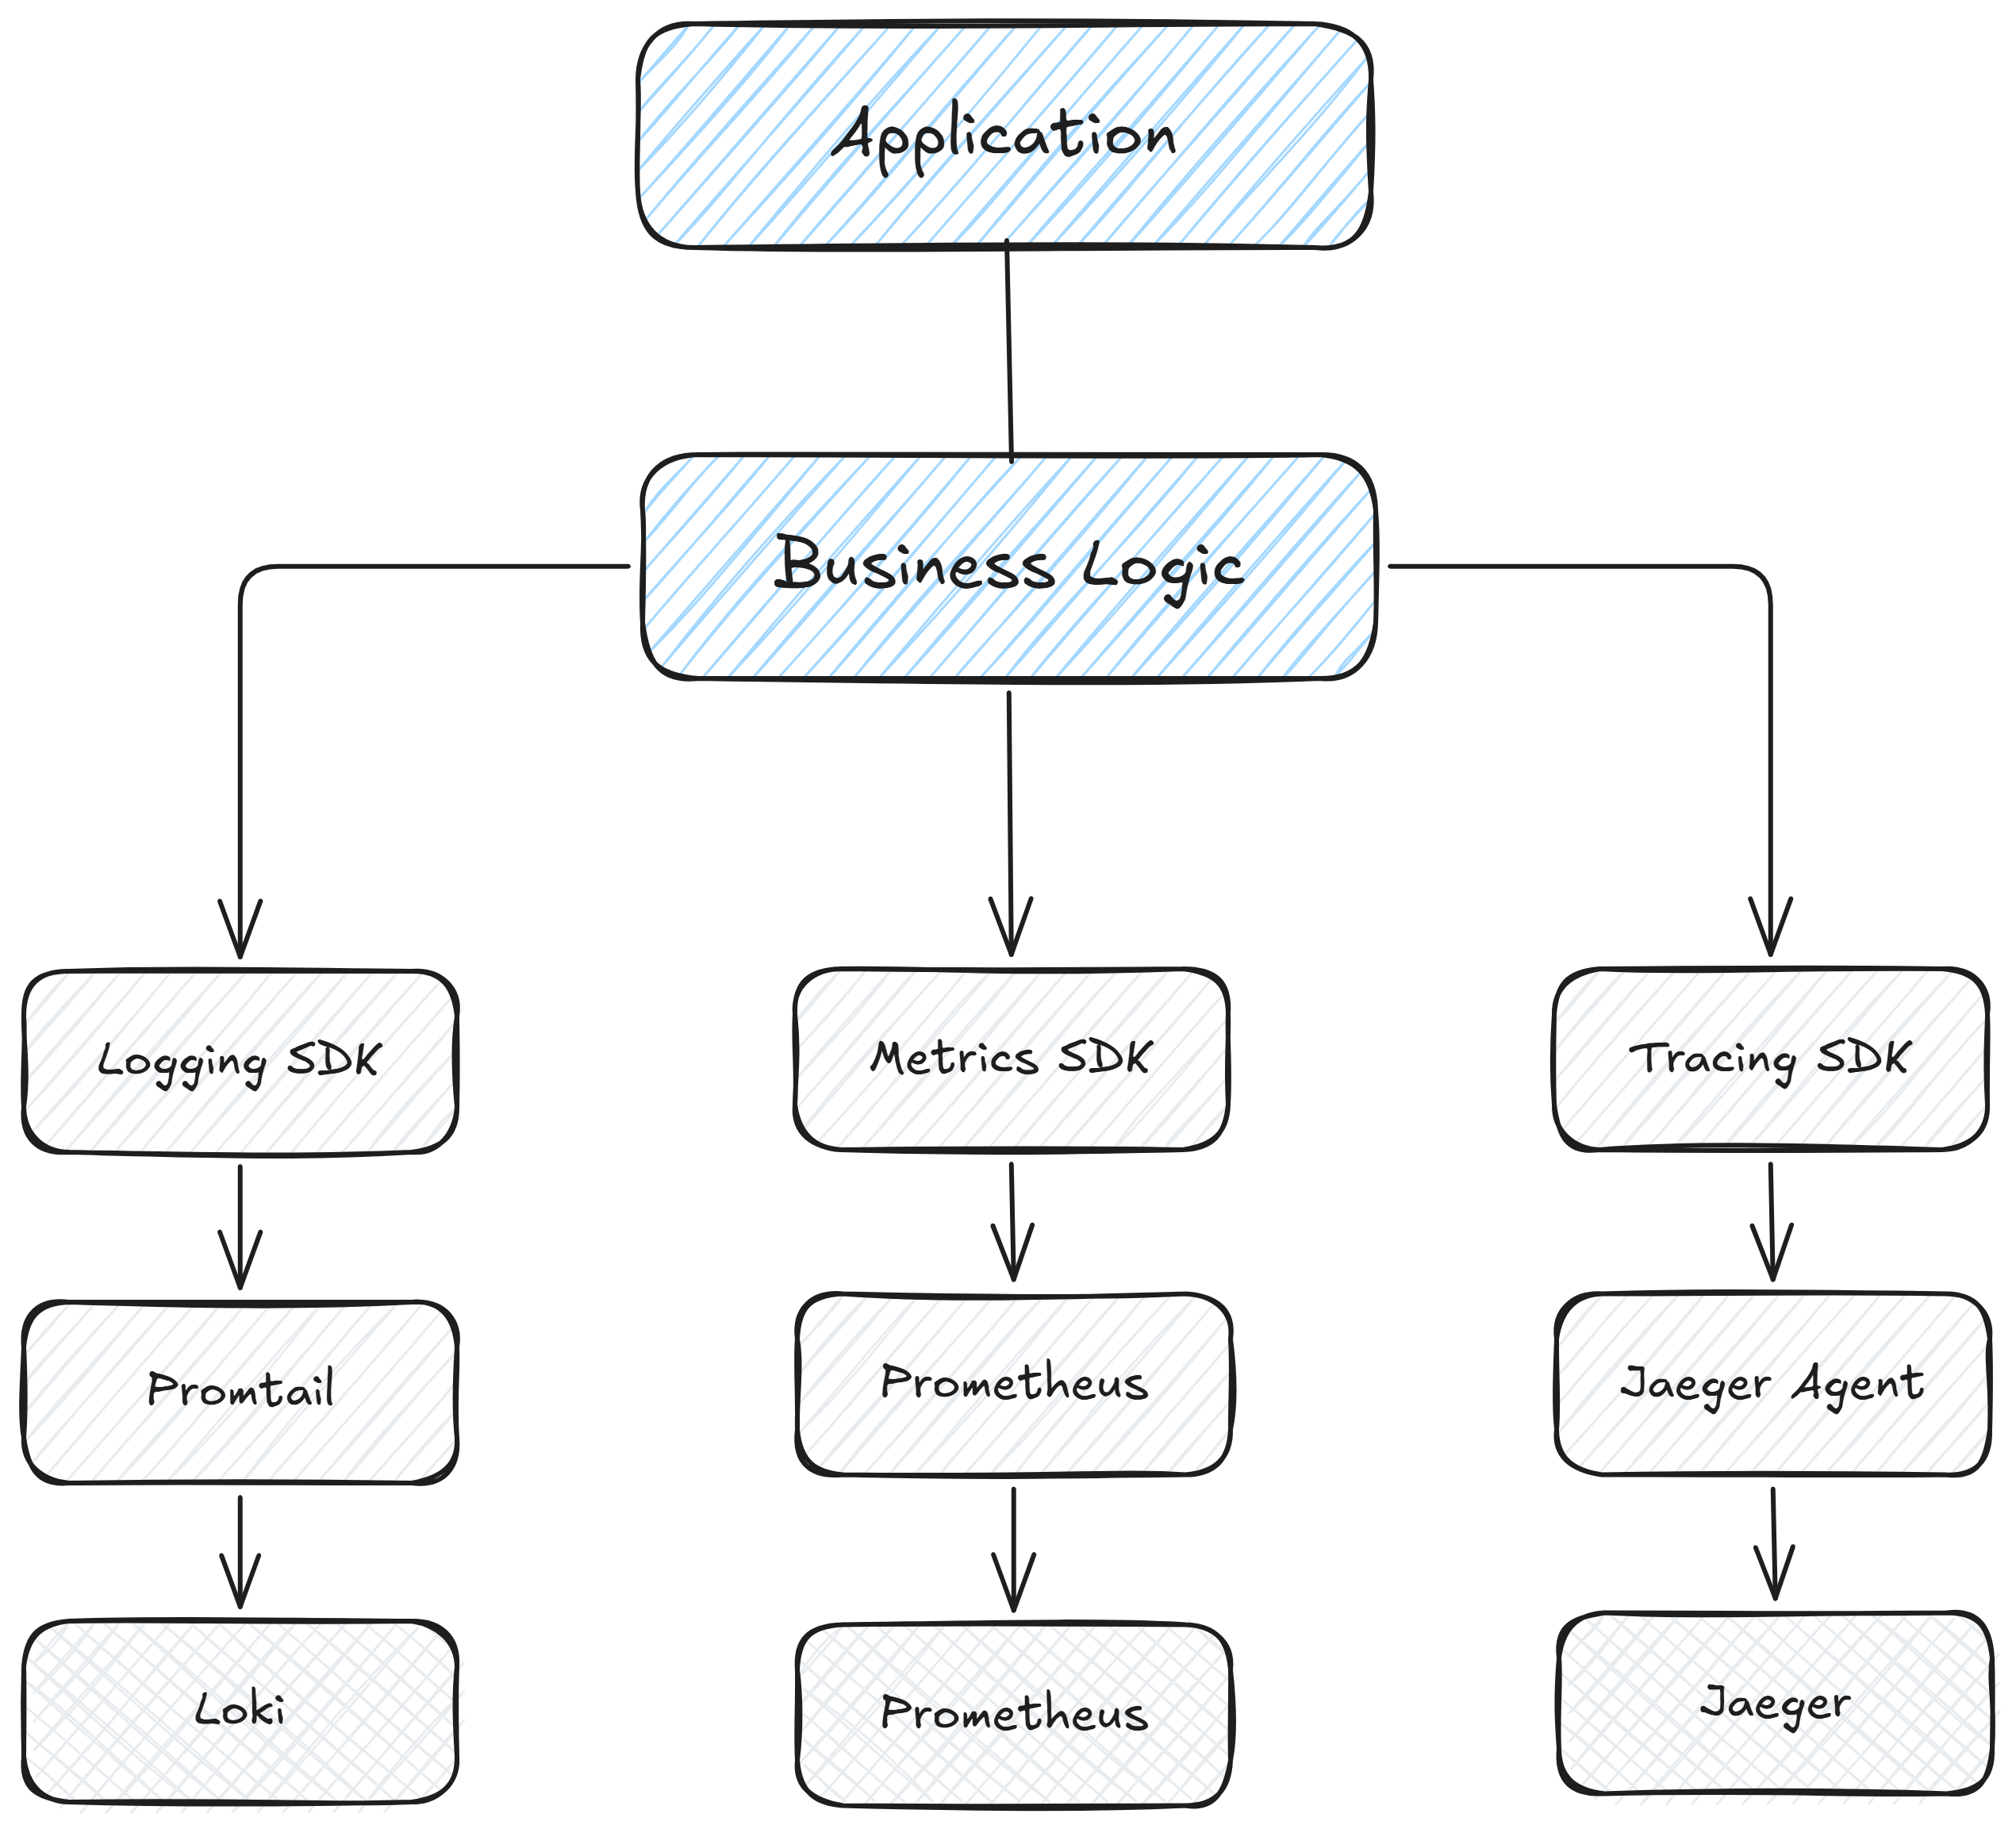
Before OpenTelemetry, observability was built by combining independent tools rather than a unified architecture. Logging, metrics, and distributed tracing each required their own SDKs, protocols, agents, collectors, and storage backends. Every signal had its own lifecycle.
A typical production service looked something like this:
A logging library such as Winston writing logs to files or stdout.
Prometheus client libraries exposing application metrics over an HTTP endpoint.
A tracing SDK such as Jaeger instrumenting requests and exporting spans.
Separate agents or collectors responsible for shipping each type of telemetry to its own backend.
Although every component solved a specific problem well, together they created a fragmented observability stack.
As systems grew from a few services to many, this architecture became increasingly difficult to operate. Every service needs multiple observability libraries, different configurations, and different export mechanisms. Instrumentation was often inconsistent between services, making telemetry harder to correlate and maintain.
The challenge was not that logging, metrics, or tracing were poor technologies. The challenge was that applications became responsible for understanding how every observability backend worked.
Business services should focus on generating telemetry, not on knowing how to communicate with multiple monitoring systems.
This architectural coupling became one of the main reasons modern production systems adopted OpenTelemetry.
Why Tracing Changed Modern Observability?
Logs and metrics have always been essential pillars of observability, but they answer different questions.
Metrics provide a high-level view of system health. They tell us what is happening, such as increased latency, high CPU usage, or a growing number of HTTP 500 responses.
Logs provide detailed events generated by an application. They capture what happened inside a specific service, making them valuable for debugging business logic and unexpected failures.
These signals work well for monolithic applications because a single request is usually handled by a single process.
Modern systems are different.
A single user request may travel through an API Gateway, authentication service, order service, payment service, inventory service, message broker, and notification service before a response is returned.
When a request crosses multiple services, understanding its complete journey becomes much harder.
Consider a checkout request: Client >>> API Gateway >>> Order Service >>> Payment Service >>> Inventory Service >>> Notification Service.
Now imagine users report that checkout requests are taking eight seconds. Metrics can tell us that latency has increased. Logs can show that the Payment Service generated an exception.
But neither can answer questions such as:
Which request experienced the problem?
How much time was spent in each service?
Which service introduced the delay?
Which dependency caused the failure?
What was the complete execution path of this request?
This is where distributed tracing changes the debugging experience.
Instead of investigating each service independently, tracing reconstructs the entire lifecycle of a request across the distributed system. Every operation becomes part of a single trace, allowing engineers to follow the request from the first incoming HTTP call to the final response.
This shift was more than a new telemetry signal. It changed how production incidents are investigated. Rather than searching through logs service by service, we can first locate the affected trace, identify where the request failed or slowed down, and then drill into the relevant logs for additional context.
In modern distributed systems, metrics tell us that a problem exists, logs explain what happened inside a service, and traces reveal where and why the problem occurred across the entire request path.
Why OpenTelemetry Emerged?
As distributed systems became more complex, observability also became more complex. Applications were no longer instrumented once. They were instrumented multiple times using different SDKs, APIs, and export mechanisms for logs, metrics, and traces.
A typical production service might include:
A logging library for structured logs.
A Prometheus client for metrics.
A Jaeger SDK for distributed tracing.
Different exporters, agents, and configuration files for each telemetry signal.
Every new observability backend introduced another integration, another dependency, and another configuration to maintain.
The challenge was no longer collecting telemetry. The challenge was standardizing how telemetry was produced.
OpenTelemetry emerged to solve this architectural problem.
Instead of applications knowing how to communicate with multiple observability systems, applications would generate telemetry using a single, standardized instrumentation model. The responsibility for processing, transforming, and exporting that telemetry would move outside the application.
The application became responsible for one thing: Produce telemetry. The observability platform became responsible for everything else.
This separation fundamentally changed observability architecture. Business services no longer needed to know whether telemetry was sent to Prometheus, Loki, Jaeger, or any other backend.
They simply emitted telemetry using OpenTelemetry.
This approach brought several important benefits:
A consistent instrumentation model across all services.
Vendor-neutral telemetry that can be exported to multiple backends.
Simpler application code with fewer observability-specific dependencies.
A centralized telemetry pipeline that can evolve independently of application releases.
OpenTelemetry did not replace logging, metrics, or tracing. It standardized how these telemetry signals are generated and transported, allowing organizations to build observability platforms that are easier to scale, maintain, and evolve over time.
Understanding OpenTelemetry Architecture
OpenTelemetry is more than a library or a collector. It defines a complete telemetry architecture where each component has a clear responsibility.
Understanding these responsibilities is essential because OpenTelemetry is designed around separation of concerns. Every layer performs a specific task without knowing the implementation details of the next layer.
A typical telemetry flow looks like this:
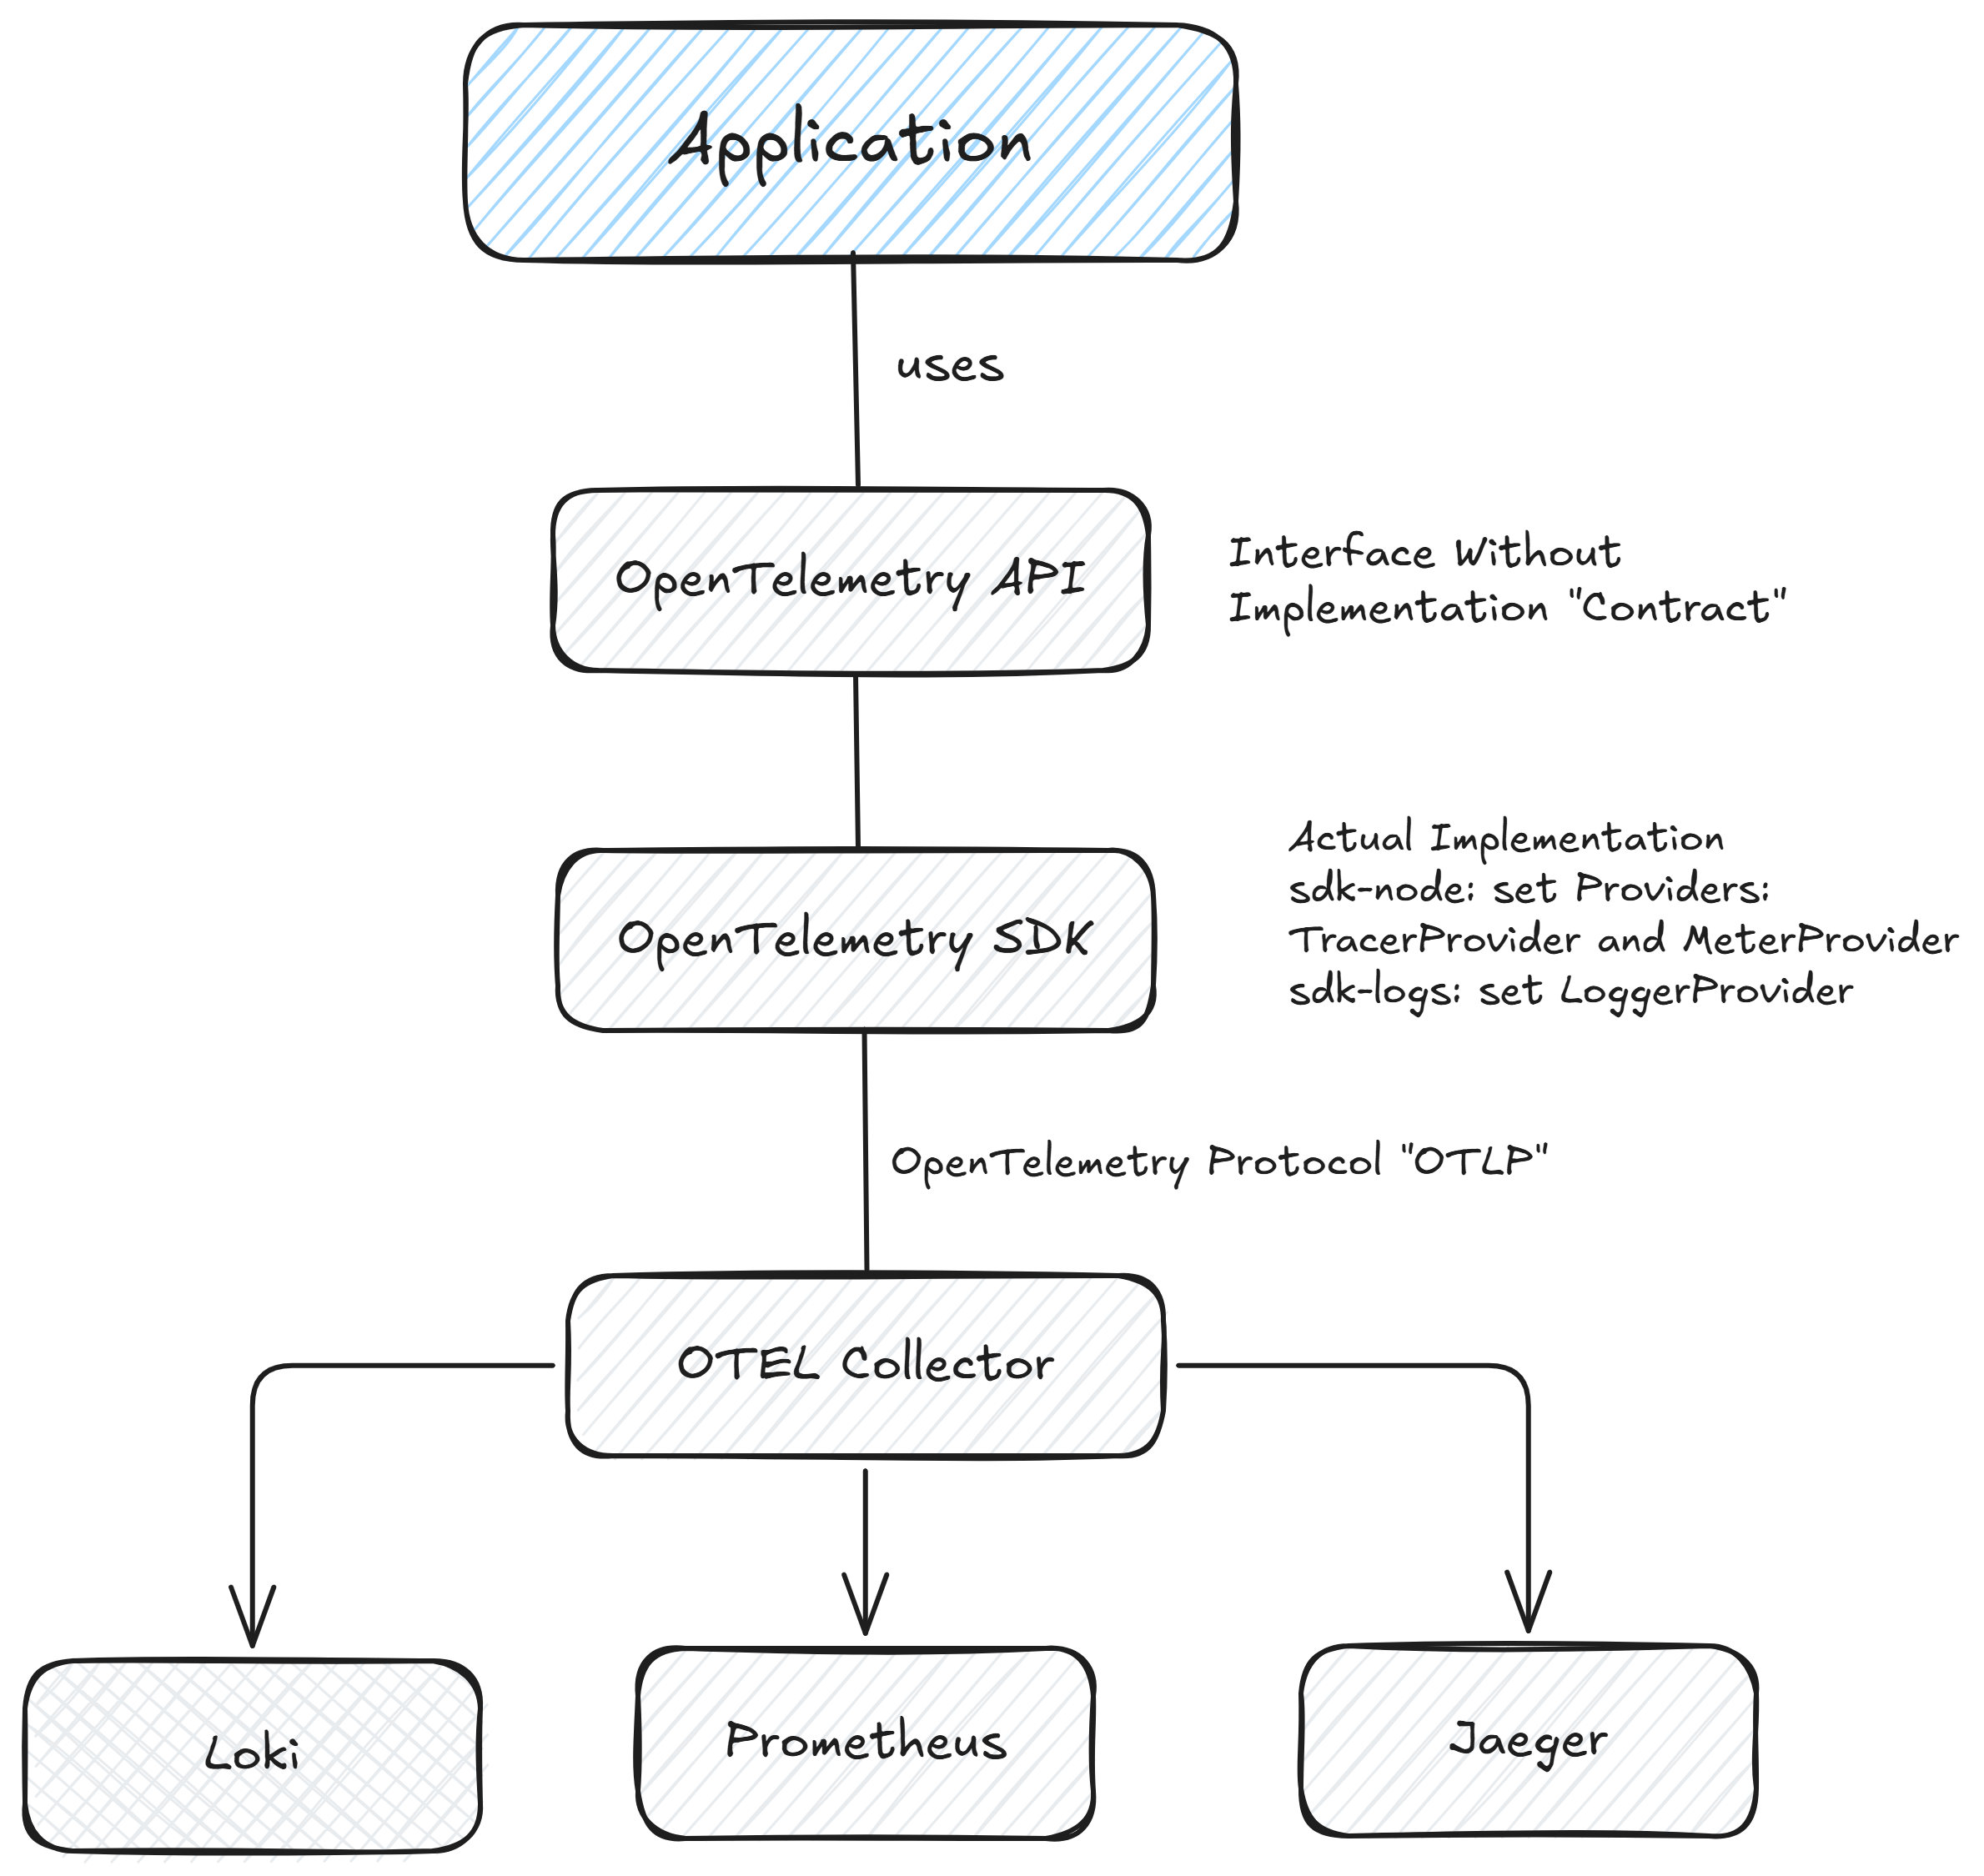
Let's walk through each layer.
OpenTelemetry API
The API is the interface developers use to instrument their applications.
When you create a span, record a metric, or enrich telemetry with attributes, your application interacts with the OpenTelemetry API.
The API defines what telemetry should be produced, but it does not collect, process, or export anything.
Think of it as a contract between your application and the OpenTelemetry ecosystem.
OpenTelemetry SDK
The SDK is responsible for turning those API calls into actual telemetry. This is where most of the work happens.
Creates spans and metrics.
Propagates context between services.
Buffers telemetry in memory.
Batches data before export.
Applies sampling policies.
Exports telemetry using the OTLP protocol.
Applications don't communicate directly with observability backends. They communicate with the SDK.
OTLP
OTLP (OpenTelemetry Protocol) is the standard protocol used to transport telemetry. Instead of every backend requiring its own exporter and protocol, the SDK sends logs, metrics, and traces using a single protocol.
This standardization is one of the key architectural improvements introduced by OpenTelemetry. It allows applications to emit telemetry once while leaving the routing decisions to the telemetry platform.
OpenTelemetry Collector
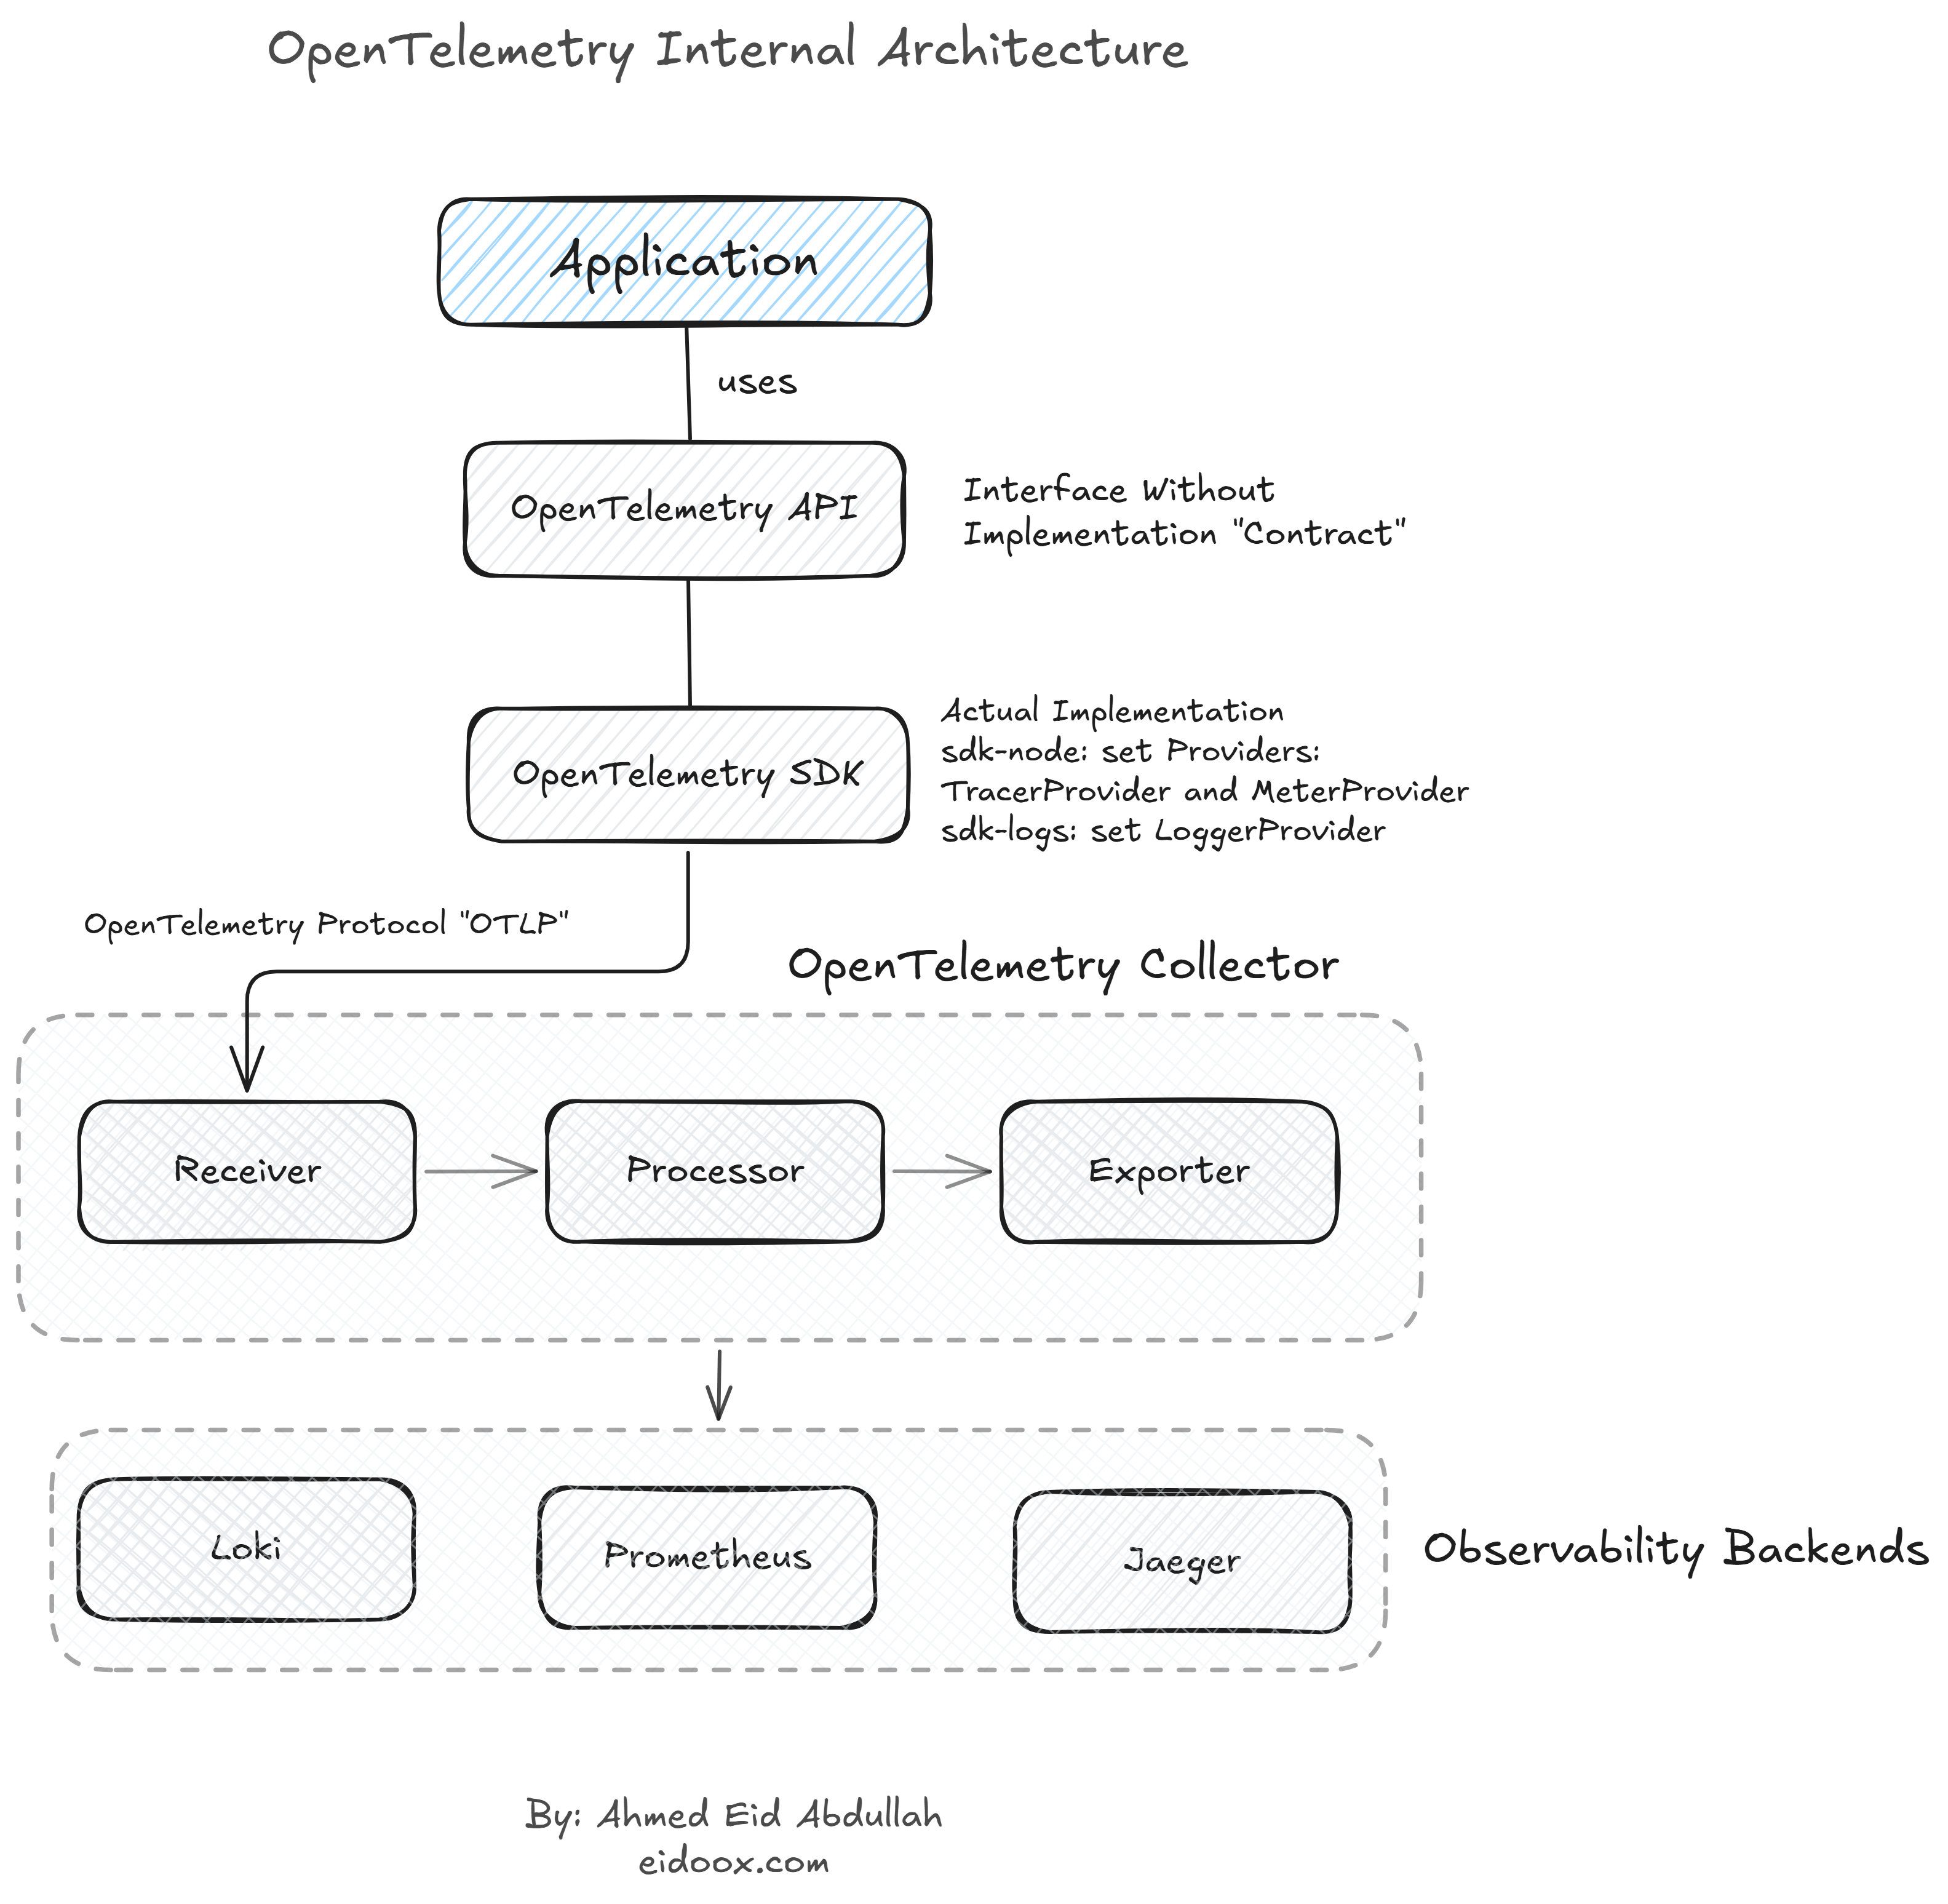
The Collector is responsible for receiving telemetry from applications and processing it before it reaches storage backends. It acts as the central telemetry pipeline for the entire platform.
Applications no longer need to know whether telemetry is ultimately stored in Prometheus, Loki, Jaeger, Datadog, or another observability system.
They simply send telemetry to the Collector using OTLP.
The Collector becomes responsible for receiving, processing, enriching, batching, sampling, and exporting telemetry to one or more destinations.
This separation keeps application code simple while allowing the observability platform to evolve independently.
This layered architecture is what makes OpenTelemetry scalable. Applications generate telemetry, the SDK manages its lifecycle, OTLP standardizes its transport, and the Collector transforms telemetry into a platform capability rather than an application responsibility.
The OTel Collector Is More Than a Collector
The name Collector can be misleading. At first glance, it sounds like a simple component that receives telemetry and forwards it to an observability backend. In reality, the OpenTelemetry Collector is the central telemetry processing layer of the observability platform.
Rather than acting as a passive proxy, the Collector actively processes telemetry before it reaches storage systems.
The Collector sits between applications and observability backends, giving platform teams a centralized place to manage telemetry without modifying application code. This architectural separation provides several important capabilities.
The Collector can:
Receive telemetry from multiple sources.
Process and enrich telemetry before it is stored.
Batch telemetry to reduce network overhead.
Apply sampling policies to control storage costs.
Transform or filter telemetry based on business requirements.
Export the same telemetry to one or multiple observability backends.
Because all of these responsibilities are centralized, applications remain focused on generating telemetry instead of managing how telemetry is processed or where it is ultimately stored.
This is one of the biggest architectural shifts introduced by OpenTelemetry. Applications produce telemetry. The Collector owns the telemetry pipeline.
What Actually Happens Inside the Collector Processors?
Batch Processor
Imagine your application generates: 10,000 spans/sec
Without batching: each span will be exported, so thousands of network requests which is very expensive.
The batch processor waits for a short period (or until enough telemetry arrives) and export batch by batch only one network request per the batch which is very optimzed in cost and network.
Memory Limiter
Imagine Jeager becomes slow. The Collector keeps buffering telemetry, memory grows and suddenly out Of Memory, collector crashes
Memory Limiter will constantly checks memory usage. If memory exceeds a configured threshold: The processor tells receivers: Stop accepting new telemetry for now. Once memory decreases: It resumes accepting telemetry.
Resource Processor
Suppose every service must include: service name and env. Should every developer write: span.setAttribute(...)
No.
That's repetitive.
Resource processor adds resource attributes automatically. Incoming spans now contain consistent metadata.
Attributes Processor
Looks similar to Resource. But it works differently. The resource processor adds information about: the service, host, container, and deployment.
It edits the telemetry itself by adding or removing or updating. Production attribute processor usually:
Remove passwords
Remove JWT tokens
Rename attributes
Add custom attributes
Transform Processor
Suppose every team uses different names in the telemetry, dashboards become inconsistent. Transform Processor can normalize them.
Correlating Logs, Metrics and Traces
Before OpenTelemetry, logs, metrics, and traces were often treated as independent data sources. Each signal was stored in a different backend and investigated separately. During a production incident, we had to manually switch between dashboards, search logs using timestamps, compare metrics, and guess which log entries belonged to the affected request.
This approach became increasingly difficult as applications evolved into distributed systems where a single user request could traverse multiple services.
OpenTelemetry introduced a standardized context propagation mechanism that allows these telemetry signals to be correlated. As a request flows through the system, a Trace ID uniquely identifies the entire request, while each operation within that request is represented by its own Span ID.
Every service handling the request shares the same Trace ID.
Because the Trace ID propagates across service boundaries, every log entry, metric, and span generated during the request can be associated with the same execution path.
For example, consider a customer reporting that the checkout process failed.
A typical investigation might begin with a latency dashboard showing a spike in request duration.
Average Checkout Latency
Normal: 350 ms
Current: 4.8 s
Metrics immediately answer the first question: Is there a production problem?
The next step is to identify an affected request using distributed tracing. Opening one of the slow traces reveals the complete execution timeline.
Checkout Trace
API Gateway 15 ms
Order Service 40 ms
Payment Service 4.2 s
Inventory 18 ms
Notification 9 ms
Without reading a single log, the trace immediately identifies the Payment Service as the source of the latency.
The investigation can now focus on the relevant service instead of searching logs across the entire platform.
Because application logs include the same Trace ID, we can retrieve only the log entries associated with that request.
Trace ID: 8f3a1czzz
INFO Starting payment authorization
INFO Calling payment provider
ERROR Gateway timeout after 4 seconds
INFO Returning HTTP 500
Instead of searching millions of log lines by timestamp, engineers move directly from a trace to the exact log entries generated during that request.
This changes the investigation workflow.
Metrics indicate that a problem exists. Traces reveal where the problem occurred. Logs provide the detailed context needed to understand why it happened.
Individually, each telemetry signal is valuable. Together, they provide a complete picture of system behavior.
The Migration Outcome
Migrating to OpenTelemetry was not simply a migration from one observability tool to another.
It was a shift in architecture.
Before the migration, applications were tightly coupled to individual observability systems. Each service contained multiple instrumentation libraries, different exporters, and backend-specific integrations.
Applications were responsible for both generating telemetry and understanding how to deliver it to different observability platforms. After adopting OpenTelemetry, those responsibilities became clearly separated. Applications generate standardized telemetry.
The OpenTelemetry SDK manages telemetry creation and context propagation.
The OpenTelemetry Collector processes, enriches, samples, and routes telemetry.
Observability backends simply receive processed telemetry.
This architecture provides a clear separation between application development and observability infrastructure. Applications no longer need to know which monitoring platform is used, how telemetry is processed, or where it is stored.
Those concerns belong to the observability platform.
As a result, instrumentation becomes consistent, telemetry pipelines become centralized, and observability backends can evolve independently without requiring application changes.
The migration was not about replacing Prometheus, Loki, or Jaeger.
It was about introducing a standardized telemetry layer that decouples applications from observability vendors and establishes observability as a platform capability rather than an application concern.
The greatest value of OpenTelemetry is not that it generates logs, metrics, or traces. It is that it standardizes how telemetry is produced, transported, processed, and correlated, allowing applications to remain focused on business logic while the observability platform owns the telemetry lifecycle.
If you found this insightful, follow me for more production lessons from real distributed systems. I’ll be sharing deeper architectural insights, failures we only learn after hitting production scale, and the engineering decisions that don’t usually make it into tutorials.
More production insights and distributed systems technical articles coming soon.
Comments
Join the discussionNo comments yet. Be the first to comment.
Distributed Systems Engineering
A collection of deep technical articles exploring how modern distributed and real-time systems are designed, built, scaled, and operated. This series covers event-driven architectures, messaging systems such as Kafka and RabbitMQ, asynchronous processing with BullMQ, WebSockets and real-time communication, caching, data consistency, scalability patterns, reliability engineering, and the architectural principles behind production-grade backend systems.


